Key Takeaways
- A CDR report is the raw data the module stored, formatted by Bosch software. It is not an analysis or an opinion.
- The parts that matter most are the data limitations, the event summary, the pre-crash data, and the crash pulse.
- Every number in the report comes with manufacturer-specific conditions. The same value can mean different things on different vehicles.
- Reading the report correctly is the service. Producing it is the easy part.
What a CDR report is, and is not
When a technician images a vehicle's airbag control module with the Bosch Crash Data Retrieval tool, the software produces a PDF report. That report is a formatted presentation of exactly what the module stored, translated from raw bytes into tables and graphs using the manufacturer's published definitions. It contains no interpretation. The report will show a recorded speed and a brake switch state at a moment before the event. It will not tell you who was at fault, whether the driver could have stopped, or how the impact relates to the physical damage. That is the work of an analyst reading the report alongside the scene and vehicle evidence.
Reports vary by manufacturer because each one records different elements, but the overall structure is consistent. These are the parts you will see.
File information
The first page identifies the download itself: the VIN as read from the module, the date and time of retrieval, the software version, who performed the download, and a hash value that lets anyone verify the data file has not been altered since. It is the chain-of-custody page.
Data limitations
Before any data appears, the manufacturer provides several pages explaining how each recorded element is derived, how often it is sampled, how accurate it is, and the conditions under which it can be misleading. Speed, for example, is calculated from wheel sensors rather than measured directly, and the way time is counted relative to the crash differs between manufacturers.
This is the section that separates a correct reading from a confident wrong one. The same number can mean something different on a Ford than on a Toyota, and the limitations pages are where those differences live. We read them for every report before we read anything else.
Event summary and system status
Next come tables describing the event and the state of the vehicle's systems. They cover things like how many events the module stored, which airbags and pretensioners deployed, whether the seatbelts were buckled, whether the airbag warning lamp was on before the crash, and whether the module finished writing the record.
Ignition cycles
One item here deserves a plain explanation because it comes up constantly. The module counts how many times the vehicle has been started over its life. The report shows that count at the moment of the event and again at the moment of the download. The difference between the two tells you how many times the vehicle was started after the crash. A small gap is reassuring. A large one raises the question of whether the recorded event is actually the crash being investigated, or something that happened later.
Pre-crash data
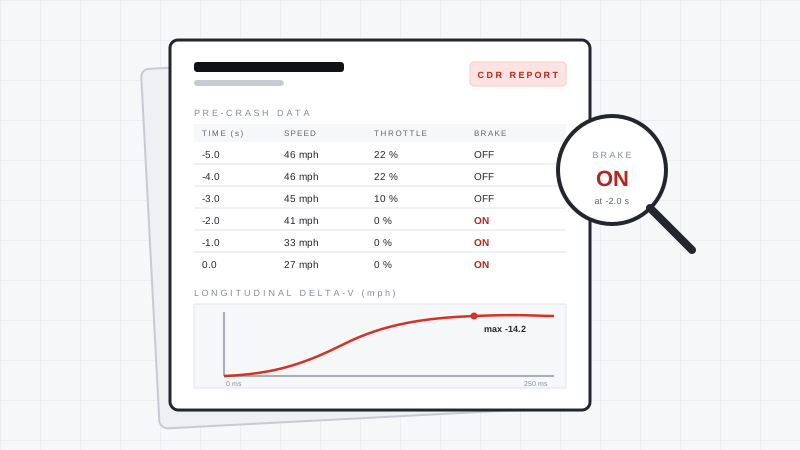
For most disputes this is the heart of the report. It is a table covering roughly the five seconds before the event, with the vehicle's recorded speed, accelerator position, brake switch state, and often engine speed, steering input, and stability-control activity at each interval. Read as a sequence, it describes what the vehicle was doing as the crash approached.
It is also the section most often misread. The values are sampled at intervals, the last row is not the instant of impact, and the speed figure carries the wheel-sensor caveats from the limitations pages. A single number quoted from this table without that context is how disputes get worse rather than better.
Crash pulse
After the pre-crash data come graphs of the change in velocity during the impact itself, usually over the first few hundred milliseconds. This is the delta-V, and its size and shape are the primary measure of how severe the crash was. The peak value and how quickly it was reached are reported as well. Delta-V is frequently compared against injury claims, which is a comparison with real pitfalls and one we will cover in its own guide.
Hexadecimal data
The final pages are the raw bytes read from the module, printed in hexadecimal. Nobody reads these in the ordinary course. They exist so the translated tables can be checked against the source if the interpretation is ever questioned. Their presence is part of what makes the report trustworthy.
Where we come in
Producing the report takes an hour. Reading it correctly takes training in how each manufacturer records data, what the limitations mean for the specific vehicle, and how the numbers fit the physical evidence. For claims that turn on the data, we provide a written analysis that puts the report in context and holds up under cross-examination. Our guide on which vehicles can be imaged explains why the available elements differ by manufacturer.
Frequently asked questions
How long is a typical CDR report?
Anywhere from about fifteen to more than forty pages, depending on the manufacturer and how many events are stored. Most of the length is data limitations and hexadecimal data.
Is the CDR report the same as an accident reconstruction?
No. The report is the raw recorded data in readable form. A reconstruction interprets that data together with scene evidence, vehicle damage, and physics to explain how the crash happened.
Do you interpret the report, or just provide it?
Both. Every download comes with the standard Bosch CDR report. When a matter turns on the data, we provide a written forensic analysis and expert testimony as needed.
Have a Report You Need Read?
We provide written forensic analysis of CDR data and expert testimony when the matter requires it.